记录ArcGIS For JS 4.7版本的一些特性。
WebGL rendering updates
这些更新体现在FeatureLayer,FeatureLayerView,TextSymbol中。
FeatureLayer
性能提升,对于代码级别没啥可说的。
FeatureLayerView
FeatureLayerView 负责将FeatureLayer中的要素渲染进view中。并且FeatureLayerView提供了方法在view中查询和高亮FeatureLayer中的要素。
属性
updatingreadonly:
当图层处于更新状态的时候(如:正在获取数据),值为true。因此,我们可以监控这个这个属性,当它的值为true时,表明它在获取数据,当它的值为false时,说明它获取数据成功。1
2
3
4
5
6
7
8
9
10
11
12
13
14var lyr = new FeatureLayer({
url: fsUrl // points to a Feature Service layer url
});
//view的whenLayerView监控lyr所对应的LayerView创建成功时理解执行then
view.whenLayerView(lyr).then(function(lyrView){
lyrView.watch("updating", function(val){
if(!val){ // wait for the layer view to finish updating
lyrView.queryExtent().then(function(results){
view.goTo(results.extent); // go to the extent of all the graphics in the layer view
});
}
});
});
方法
highlight(target)→Object
高亮指定的feature(s)
该方法是通过objectID来从当前的view中检索要被高亮的要素。因此可以传入objectID也可以串包含objectID的graphics.1
2
3
4
5
6
7
8
9
10
11var highlight;
view.whenLayerView(treesLayer).then(function(lyrView){
var query = treesLayer.createQuery();
query.where = "type = 'Quercus'";
treesLayer.queryFeatures(query).then(function(result){
if (highlight) {
highlight.remove();
}
highlight = lyrView.highlight(result.features);
})
});
该方法的返回值中有一个remove方法用来清楚高亮显示。
注: 在2D场景中,只支持
WebGL渲染。
2
3
4
5
6
> has: {
> "esri-featurelayer-webgl": 1
> }
> };
>将上面的代码写在引入ArcGIS API for JavaScript之前即可。
queryExtent(params),queryFeatureCount(params)
计算 绘制到 当前视图的符合查询条件的要素的Extent和Count。如果想要计算该要素服务中符合查询条件的所有要素的Extent和Count则需要使用FeatureLayer类中对应的方法了。
TextSymbol
开始支持在FeatureLayer中使用了。并且开始支持多行文本。
TextSymbol是用于定义FeatureLayer中graphic展示的label。可被用于点、线、面要素。
Client-side projection
添加了新的模块esri/geometry/projection,提供了一个客户端投影转换引擎。
该某块的 project → Geometry|Geometry[] 方法即支持默认的投影转换方法,也支持自定义的投影转换方法。默认的投影转换方法可以通过getTransformation去查看,不同的投影之间的转换默认的方法是不一样的。
1 | function projectData(wkid) { |
注:
- 浏览器必须支持
WebAssembly- 仅支持基于方程的投影转换。可参考常用的投影转换方法
Mobile support in 3D
支持在手机上创建3D web 应用。硬件要求
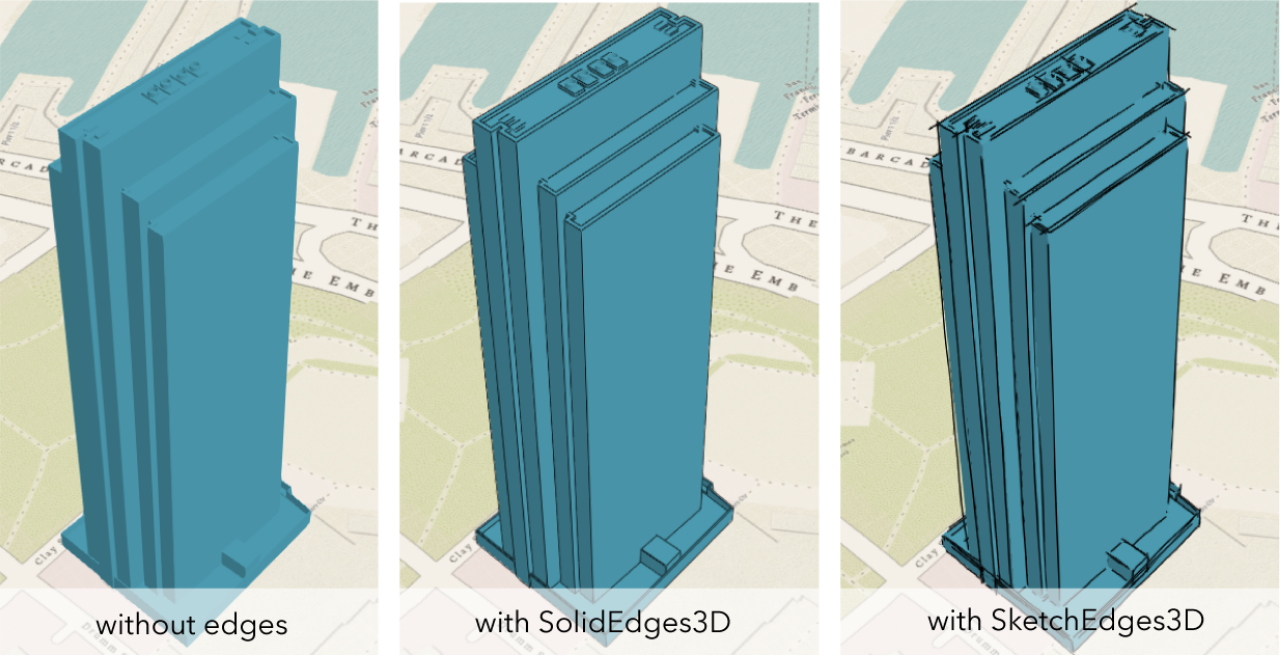
Edge rendering for 3D Object SceneLayer
在4.7版本中,通过渲染建筑物的轮廓边缘和挤压多边形来提升3D场景中对物体形状的感知。
esri新增了esri/symbols/edges/Edges3D为特定的Symbol3DLayer设置edge属性,便可激活边缘渲染还可以设置边缘的颜色。
目前只支持两类边缘效果:SolidEdges3D和SketchEdges3D
注:
FillSymbol3DLayer的edge属性必须为MeshSymbol3DExtrudeSymbol3DLayer的edge属性必须为PolygonSymbol3D
Widget updates
Coordinate Conversion widget
该widget展示了在所选择的坐标系下的用户鼠标位置。默认情况下,该组件如下坐标格式:
- XY - Longitude, Latitude (WGS84)
- MGRS - Military Grid Reference System
- UTM - Universal Transverse Mercator
- DD - Decimal Degrees
- DDM - Degrees Decimal Minutes
- DMS - Degrees Minutes Seconds
- Basemap - X, Y in the coordinate system used by the current Basemap in the units used by the Basemap. Web Mercator is the standard for Esri-provided basemaps.
将该组件添加到我们的代码中很简单:1
2
3
4
5
6var ccWidget = new CoordinateConversion({
view: view
});
// Adds widget in the bottom left corner of the view
view.ui.add(ccWidget, "bottom-left");
除了这些默认的格式外,我们还可以自定义格式。
- 定义一个转换函数和一个逆转换函数
- 或者,定义一个空间参考和一个逆转换函数
- 必要的时候可以使用Geometry Service来进行投影转换。
参考示例:1
2
3
4
5
6
7
8
9
10
11
12
13
14
15
16
17
18
19
20
21
22
23
24
25
26
27
28
29
30
31
32
33
34
35
36
37
38
39
40
41
42
43
44
45
46
47
48
49
50
51
52
53
54
55
56
57
58
59
60
61
62
63
64
65
66
67
68
69
70
71
72
73
74
75
76
77
78
79
80
81
82
83
84
85
86
87
88
89
90
91
92
93
94
95
96
97
98
99
100
101
102
103
104
105
106
107
108
109
110
111
112
113
114
115
116
117
118
119
120
121
122
123
124
125
126
127
128
129
130
131
132
133
134
135
136
137
138
139
140
141
142
143
144
145
146
147
148
149
150
151
152
153
154
155
156
157
158
159
160
161
162
163
164
165
166
167
168
169
170
171
172
173
174
175
176
177
178
179
180
181
182
183
184
185
186
187
188
189
190
191
192
193
194
195
196
197
198
199
<html>
<head>
<meta charset="utf-8">
<meta name="viewport" content="initial-scale=1, maximum-scale=1,user-scalable=no">
<title>CoordinateConversion widget - Custom Formats - 4.7</title>
<link rel="stylesheet" href="https://js.arcgis.com/4.7/esri/css/main.css">
<style>
html,
body,
#viewDiv {
padding: 0;
margin: 0;
height: 100%;
width: 100%;
overflow: hidden;
}
</style>
<script src="https://js.arcgis.com/4.7/"></script>
<script>
require([
"esri/Map",
"esri/views/SceneView",
"esri/widgets/CoordinateConversion",
"esri/widgets/CoordinateConversion/support/Format",
"esri/widgets/CoordinateConversion/support/Conversion",
"esri/geometry/Point",
"esri/geometry/support/webMercatorUtils",
"esri/geometry/SpatialReference",
"dojo/domReady!"
], function(
Map, SceneView, CoordinateConversion, Format, Conversion,
Point, webMercatorUtils, SpatialReference
) {
var map = new Map({
basemap: "hybrid",
ground: "world-elevation"
});
var view = new SceneView({
container: "viewDiv",
map: map,
// Clip the view to the extent covered by
// by NAD 1983 HARN StatePlane California I
clippingArea: {
xmin: -124.45,
xmax: -119.99,
ymax: 43.01,
ymin: 39.59
},
center: {
x: -122.22,
y: 41.3
},
zoom: 10,
viewingMode: "local"
});
view.when(function(view) {
view.goTo({
tilt: 45
})
});
var ccWidget = new CoordinateConversion({
view: view
});
view.ui.add(ccWidget, "top-right");
// Regular expression to find a number
var numberSearchPattern = /-?\d+[\.]?\d*/;
/**
* Create a new Format called XYZ, which looks like: "<Latitude>, <Longitude>, <Z>"
*
* We need to define a convert function, a reverse convert function,
* and some formatting information.
*/
var newFormat = new Format({
// The format's name should be unique with respect to other formats used by the widget
name: "XYZ",
conversionInfo: {
// Define a convert function
// Point -> Position
convert: function(point) {
var returnPoint = point.spatialReference.isWGS84 ? point :
webMercatorUtils.webMercatorToGeographic(point);
var x = returnPoint.x.toFixed(4);
var y = returnPoint.y.toFixed(4);
var z = returnPoint.z.toFixed(4);
return {
location: returnPoint,
coordinate: `${x}, ${y}, ${z}`
};
},
// Define a reverse convert function
// String -> Point
reverseConvert: function(string) {
var parts = string.split(",")
return new Point({
x: parseFloat(parts[0]),
y: parseFloat(parts[1]),
z: parseFloat(parts[2]),
spatialReference: {
wkid: 4326
}
});
}
},
// Define each segment of the coordinate
coordinateSegments: [
{
alias: "X",
description: "Longitude",
searchPattern: numberSearchPattern
},
{
alias: "Y",
description: "Latitude",
searchPattern: numberSearchPattern
},
{
alias: "Z",
description: "Elevation",
searchPattern: numberSearchPattern
}],
defaultPattern: "X°, Y°, Z"
});
// add our new format to the widget's dropdown
ccWidget.formats.add(newFormat);
/**
* Create a new Format 'SPS I', which looks like: "<X>, <Y>" in the
* California StatePlane Zone I Spatial Reference, described by wkid 102241
*
* For this Format, we only need to provide a spatialReference with the correct
* wkid. The geometry service can take care of the rest.
*/
var stateplaneCA = new Format({
name: "SPS I",
conversionInfo: {
spatialReference: new SpatialReference({
wkid: 102241
}),
reverseConvert: function(string, format) {
var parts = string.split(",")
return new Point({
x: parseFloat(parts[0]),
y: parseFloat(parts[1]),
spatialReference: {
wkid: 102241
}
});
}
},
coordinateSegments: [
{
alias: "X",
description: "easting",
searchPattern: numberSearchPattern
},
{
alias: "Y",
description: "northing",
searchPattern: numberSearchPattern
}],
defaultPattern: "X, Y"
});
// Add our new format to the widget's dropdown
ccWidget.formats.add(stateplaneCA);
// Add the two custom formats to the top of the widget's display
ccWidget.conversions.splice(0, 0,
new Conversion({
format: newFormat
}),
new Conversion({
format: stateplaneCA
})
);
});
</script>
</head>
<body class="calcite">
<div id="viewDiv"></div>
</body>
</html>
3D Area Measurement widget
AreaMeasurement3D 微件可用于在3D场景中测量面积和周长。
DirectLineMeasurement3D 微件可用于在3D场景中测量垂直、水平方向的距离和亮点之间的直线方向。可用于分析两个地址之间的相对高差。
注: 当view.padding被设置了如:
2
3
4
5
6
7
8
9
10
11
12
> container: "viewDiv",
> map: map,
> center: [-74.045459, 40.690083], // Liberty Island, NY, USA
> zoom: 16,
> padding: {
> right: 320 // Same value as the #sidebar width in CSS
> }
> });
> //或者
> //view.padding.right = 320;
>AreaMeasurement3D和DirectLineMeasurement3D便都不能使用。
Legend widget card style
为Legend的style属性添加了一个card选项。card样式可以根据view的大小来显示不同的布局,对于手机来说很方便。1
2
3
4
5var legend = new Legend({
view: view,
style: "card" // other styles include 'classic'
});
view.ui.add(legend, "bottom-left");
LayerList updates
为LayerList微件的ListItem添加panels属性,以允许向图层列表中添加widgets,text,DOM元素等自定义内容。panels是ListItemPanel的实例。ListItemPanel对象不能被实例化,它只是用来定义panels的格式 .1
2
3
4
5
6
7var layerList = new LayerList({
view: view
});
// Adds widget below other elements in the top left corner of the view
view.ui.add(layerList, {
position: "top-left"
});
listItemCreatedFunction属性用于访问每个ListItem,可以通过它来改变每个ListItem相应的属性,通过ListItem的actionsSections属性可以为为ListItem添加action。
还可以对LayerList进行自定义操作:
LayerList提供了trigger-action事件来处理action。1
2
3
4
5
6
7
8
9
10
11
12
13
14
15
16
17
18
19
20
21
22
23
24
25
26
27
28
29
30
31
32
33
34
35
36
37
38
39
40
41
42
43
44
45
46
47
48
49
50
51
52
53
54
55
56
57
58
59
60
61
62
63
64
65
66
67
68
69
70
71
72
73
74
75
76
77
78
79
80
81
82
83//定义LayerList
var layerList = new LayerList({
view: view,
// executes for each ListItem in the LayerList
listItemCreatedFunction: defineActions
});
function defineActions(event) {
// The event object contains an item property.
// s a ListItem referencing the associated layer
// and other properties. You can control the visibility of the
// item, its title, and actions using this object.
var item = event.item;
if (item.title === "US Demographics") {
// An array of objects defining actions to place in the LayerList.
// By making this array two-dimensional, you can separate similar
// actions into separate groups with a breaking line.
item.actionsSections = [
[{
title: "Go to full extent",
className: "esri-icon-zoom-out-fixed",
id: "full-extent"
}, {
title: "Layer information",
className: "esri-icon-description",
id: "information"
}], [{
title: "Increase opacity",
className: "esri-icon-up",
id: "increase-opacity"
}, {
title: "Decrease opacity",
className: "esri-icon-down",
id: "decrease-opacity"
}]
];
}
}
//使用trigger-action事件为每个action添加事件处理程序
layerList.on("trigger-action", function(event) {
// The layer visible in the view at the time of the trigger.
var visibleLayer = USALayer.visible ? USALayer : censusLayer;
// Capture the action id.
var id = event.action.id;
if (id === "full-extent") {
// If the full-extent action is triggered then navigate
// to the full extent of the visible layer.
view.goTo(visibleLayer.fullExtent);
} else if (id === "information") {
// If the information action is triggered, then
// open the item details page of the service layer.
window.open(visibleLayer.url);
} else if (id === "increase-opacity") {
// If the increase-opacity action is triggered, then
// increase the opacity of the GroupLayer by 0.25.
if (demographicGroupLayer.opacity < 1) {
demographicGroupLayer.opacity += 0.25;
}
} else if (id === "decrease-opacity") {
// If the decrease-opacity action is triggered, then
// decrease the opacity of the GroupLayer by 0.25.
if (demographicGroupLayer.opacity > 0) {
demographicGroupLayer.opacity -= 0.25;
}
}
});
LayerList微件的新属性panels,允许向图层列表中添加其他微件,这里将Legend微件添加到LayerList。1
2
3
4
5
6
7
8
9
10
11
12
13// Add a legend instance to the panel of a
// ListItem in a LayerList instance
const layerList = new LayerList({
view: view,
listItemCreatedFunction: function (event) {
const item = event.item;
item.panel = {
content: "legend",
open: true
};
}
});
view.ui.add(layerList, "top-right");
-
1
2
3
4
5
6
7
8
9
10
11
12
13
14
15
16
17
18
19
20
21
22
23
24
25
26
27
28
29
30
31
32let layerList = new LayerList({
view: view,
container: document.createElement("div"),
listItemCreatedFunction: function (event) {
const item = event.item;
// add the pie chart to the Predominance layer list item panel
if(item.title === predominanceLayer.title){
item.panel = {
content: [
[ "<b>Educational attainment</b> refers to the highest level of education that an individual has completed. ",
"This chart categorizes the population living within the current ",
"view extent by their educational attainment."
].join(""),
document.createElement("canvas"),
[ "Notice that while one attainment level appears to dominate certain regions, it doesn't ",
"necessarily mean it represents the majority of the population. In fact, as ",
"you explore most areas, you will find the predominant educational attainment makes up ",
"just a fraction of the population due to the number of categories considered."
].join("")
],
className: "esri-icon-pie-chart",
open: item.visible
};
}
}
});
layerList.container.style = "height: 100%";
let panelDiv = document.getElementById("panel");
panelDiv.appendChild(layerList.container);
Draw updates
Custom builds with npm and webpacks
现在可以直接使用npm和webpack直接下载和打包ArcGIS API for JavaScript了。但是我发现下载的API有近30M,还是觉得有点太大,不适合这样的方式。为了方便ArcGIS API for JavaScript与ES6更好的结合使用,这里推荐esri-import.该中间件利用ES6的Decorator将ArcGIS API for JavaScript的模块注入到相应的类中。
Better support for ES promises
以前的版本不支持ES6的Promise,从4.7开始完全兼容ES6的Promise
Smart Mapping updates
Smart Mapping目前支持Feature Collections,Arcade expressions,CSVLayer等三种渲染器。